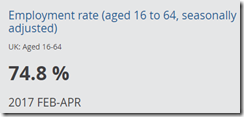
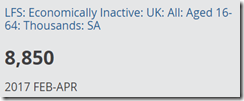
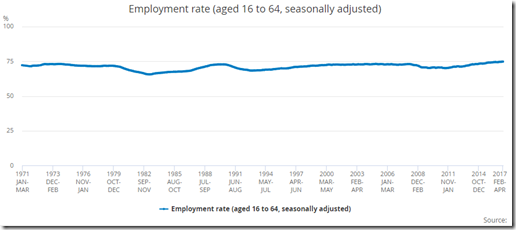
Based on ONS employment figures.
So nearly no unemployed then?
Seems like we are missing around 20%, which is the “economically inactive”:
Which translates to:
4.6% + 74.8% + 21.5% = 101%
ONS states:
Everybody aged 16 or over is either employed, unemployed or economically inactive
The definition of each of these are for people aged 16 to 64:
- Employed:
- had paid work (as an employee or self-employed)
- in a job that they were temporarily away from
- on government-supported training and employment programmes, and those doing unpaid family work
- Unemployed
- without a job, have been actively seeking work in the past 4 weeks and are available to start work in the next 2 weeks
- out of work, have found a job and are waiting to start it in the next 2 weeks
- Economically Inactive
- without a job who have not sought work in the last 4 weeks and/or are not available to start work in the next 2 weeks
- students, people looking after family and home, long-term sick and disabled, temporarily sick and disabled, retired people and discouraged workers
Employed
You are counted as employed even if you have a “zero hour contract” as you are in a job you are “temporarily away from”.
Unemployed
The key “actively seeking work” means anybody getting Jobseeker’s Allowance (JSA).
Lots of people would not register for JSA as they would not get anything anyway.
Some examples from JSA rules where you would not get anything hence people would not sign-on then:
- More than £16,000 in savings
- Your partner works more than 24 hours per week
Economically Inactive
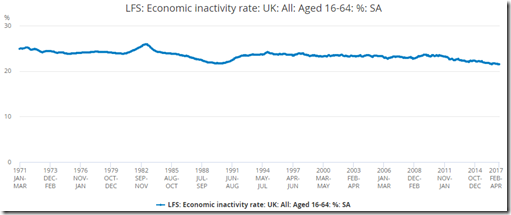
This is complex but looking at the data below it seems to be falling.
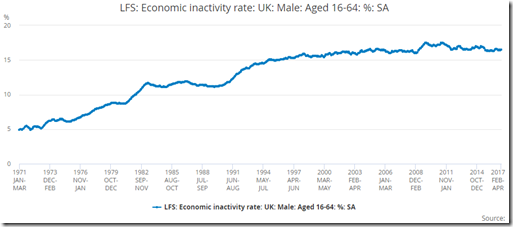
Male inactivity is increasing not sure why?:
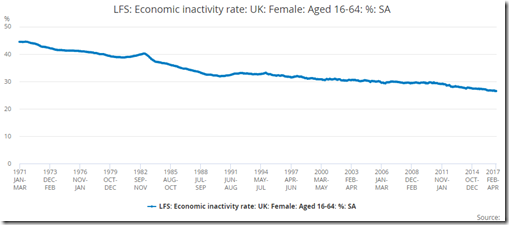
Female inactivity is falling as more females are having a career:
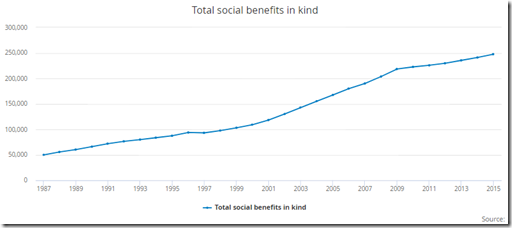
It may be explained by more people on benefits but needs further investigation as graph below is not in % of total population:

